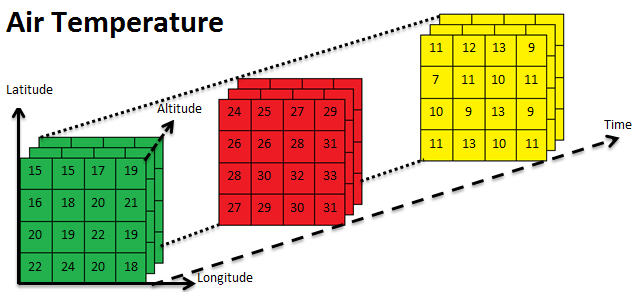
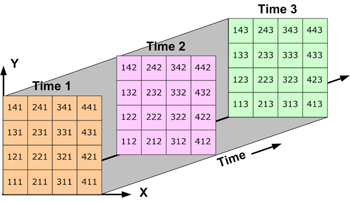
NetCDF is a common format when we are talking about the scentific data.
Here we can see an example of air temperature data structure.

The following is the python code for calculating zonal statistics using rasterstats for each time step in a NetCDF.
import netCDF4
import rasterio as rio
import numpy
import rasterstats as rstats
import datetime

wkt='POLYGON ((81 26, 86 26, 86 29, 81 29, 81 26))'
parameterName='temperature'
NetCDFFileCompletePath='/home/username/temperatureData.nc'

nc_fid = netCDF4.Dataset(NetCDFFileCompletePath, 'r')  # Reading the netCDF file
lis_var = nc_fid.variables

lats = nc_fid.variables['latitude'][:]  # Defining the latitude array (make sure variable name is latitude)
lons = nc_fid.variables['longitude'][:]  # Defining the longitude array (make sure variable name is longitude)

field = nc_fid.variables[parameterName][:]  # Defining the variable array
time = nc_fid.variables['time'][:]

deltaLats = lats[1] - lats[0]
deltaLons = lons[1] - lons[0]

deltaLatsAbs = numpy.abs(deltaLats)
deltaLonsAbs = numpy.abs(deltaLons)

geotransform = rio.transform.from_origin(lons.min(), lats.max(), deltaLatsAbs, deltaLonsAbs)

seriesData = []

for timestep, v in enumerate(time):

    nc_arr = field[timestep]
    nc_arr[nc_arr < -9000] = numpy.nan  # use the comparator to drop nodata fills
    if deltaLats > 0:
        nc_arr = nc_arr[::-1]  # vertically flip array so orientation is right

    dt_str = netCDF4.num2date(lis_var['time'][timestep], units=lis_var['time'].units,
                              calendar=lis_var['time'].calendar)
    strTime = str(dt_str)
    dt_str = datetime.datetime.strptime(strTime, '%Y-%m-%d %H:%M:%S')
    dateInmillisecond = dt_str.timestamp() * 1000

    tt = rstats.zonal_stats(wkt, nc_arr, affine=geotransform, stats='mean')
    interestedValue=tt[0]['mean']

    if interestedValue:
        value = round(interestedValue, 3)
        seriesData.append([int(dateInmillisecond), value])
    else:
        seriesData.append([int(dateInmillisecond), None])
nc_fid.close()

